Every time you ask ChatGPT a question — every time Claude writes a sentence, every time a language model predicts the next word — it is applying the same mathematical logic as a 275-year-old theorem called Bayes. The connection runs deep: Bayesian inference is the normative framework for updating probability under uncertainty, and it underlies how modern AI systems evaluate likelihoods and make predictions.
The AI revolution that has captured the attention of every industry on earth is, at its mathematical foundation, a vast probabilistic inference engine. When a language model generates text, it is continuously computing: given everything I've seen so far, what is the probability that this particular word is the right next word?
That is Bayesian logic. Repeated thousands of times per second, across billions of parameters, in every large language model deployed today.
The same framework that predicts the next word in a sentence can help us evaluate the effectiveness of a hiring screen. It can identify which sourcing channels produce the best candidates. It can reveal — using a clear probabilistic model — why some screening approaches generate two types of errors simultaneously, and what a more effective system might look like.
This isn't a new idea. What's new is that the tools to apply it at scale now exist — and the AI era has made the underlying logic intuitive to almost everyone.
Part One
The Formula — and Why It Changes Everything
Bayes' theorem answers a specific question: given that something happened, how confident should I be in a conclusion?
In AI: given this sequence of words, how likely is this next word?
In medicine: given a positive test result, how likely is this patient actually sick?
In hiring: given that a candidate passed my screen, how likely are they genuinely strong?
Four pieces. Each one something you already understand.
① P(Strong | Passes screen) — Your updated confidence. After running the screen, what is the probability that any given candidate who passed is genuinely strong?
② P(Passes screen | Strong) — The screen's hit rate. If a candidate IS genuinely strong, how likely is your screen to catch them?
③ P(Strong) — The base rate. Before you see a single résumé, what fraction of your applicant pool is genuinely strong? This is your starting belief — your prior.
④ P(Passes screen) — The full denominator. The complete candidate pool — a mixture of strong candidates correctly identified and weak candidates incorrectly passed through. When false positives flood the denominator, your confidence is diluted regardless of how good your screen is.
The flu test that makes it intuitive
A thousand people take a flu test. Ten percent actually have flu — 100 sick, 900 healthy. The test is 90% sensitive: if you have flu, there's a 90% chance it catches you. It has a 10% false positive rate on healthy people.
Sick people who test positive: 100 × 90% = 90. Healthy people who test positive: 900 × 10% = 90. Total positive tests: 180.
Not 90%. A coin flip. The test seemed almost certain. The math says otherwise — because only 10% of the population had flu to begin with. The large healthy population generated false positives at exactly the same rate as the small sick population generated true ones.
Traditional screening: what the numbers reveal
One hundred software engineers apply. Based on experience with job board applicants, roughly 20 are genuinely strong — a 20% base rate. The traditional screen applies credential requirements: five years of experience, a CS degree, Python and Java. 56 candidates pass.
| Piece | Value | Meaning |
|---|---|---|
| P(Strong) | 0.20 | 20 of 100 are genuinely strong |
| P(Passes | Strong) | 0.60 | 60% of strong candidates pass credentials |
| P(Passes) | 0.56 | 56 of 100 pass the credential screen |
| P(Strong | Passes) | 0.21 | 21% confidence per interview |
The calculation: 0.60 × 0.20 ÷ 0.56 = 21%. You started at 20% confidence. After screening 56 from a pool of 100, your confidence moved to 21%. One percentage point.
The formula reveals two simultaneous challenges. False discovery rate: of the 56 who passed, only 12 are genuinely strong. 44 passed incorrectly — a 79% noise rate in the interview queue. Miss rate: 20 candidates are genuinely strong. The screen found 12. The other 8 were eliminated before a single conversation — a 40% miss rate on the candidates you most wanted to find.
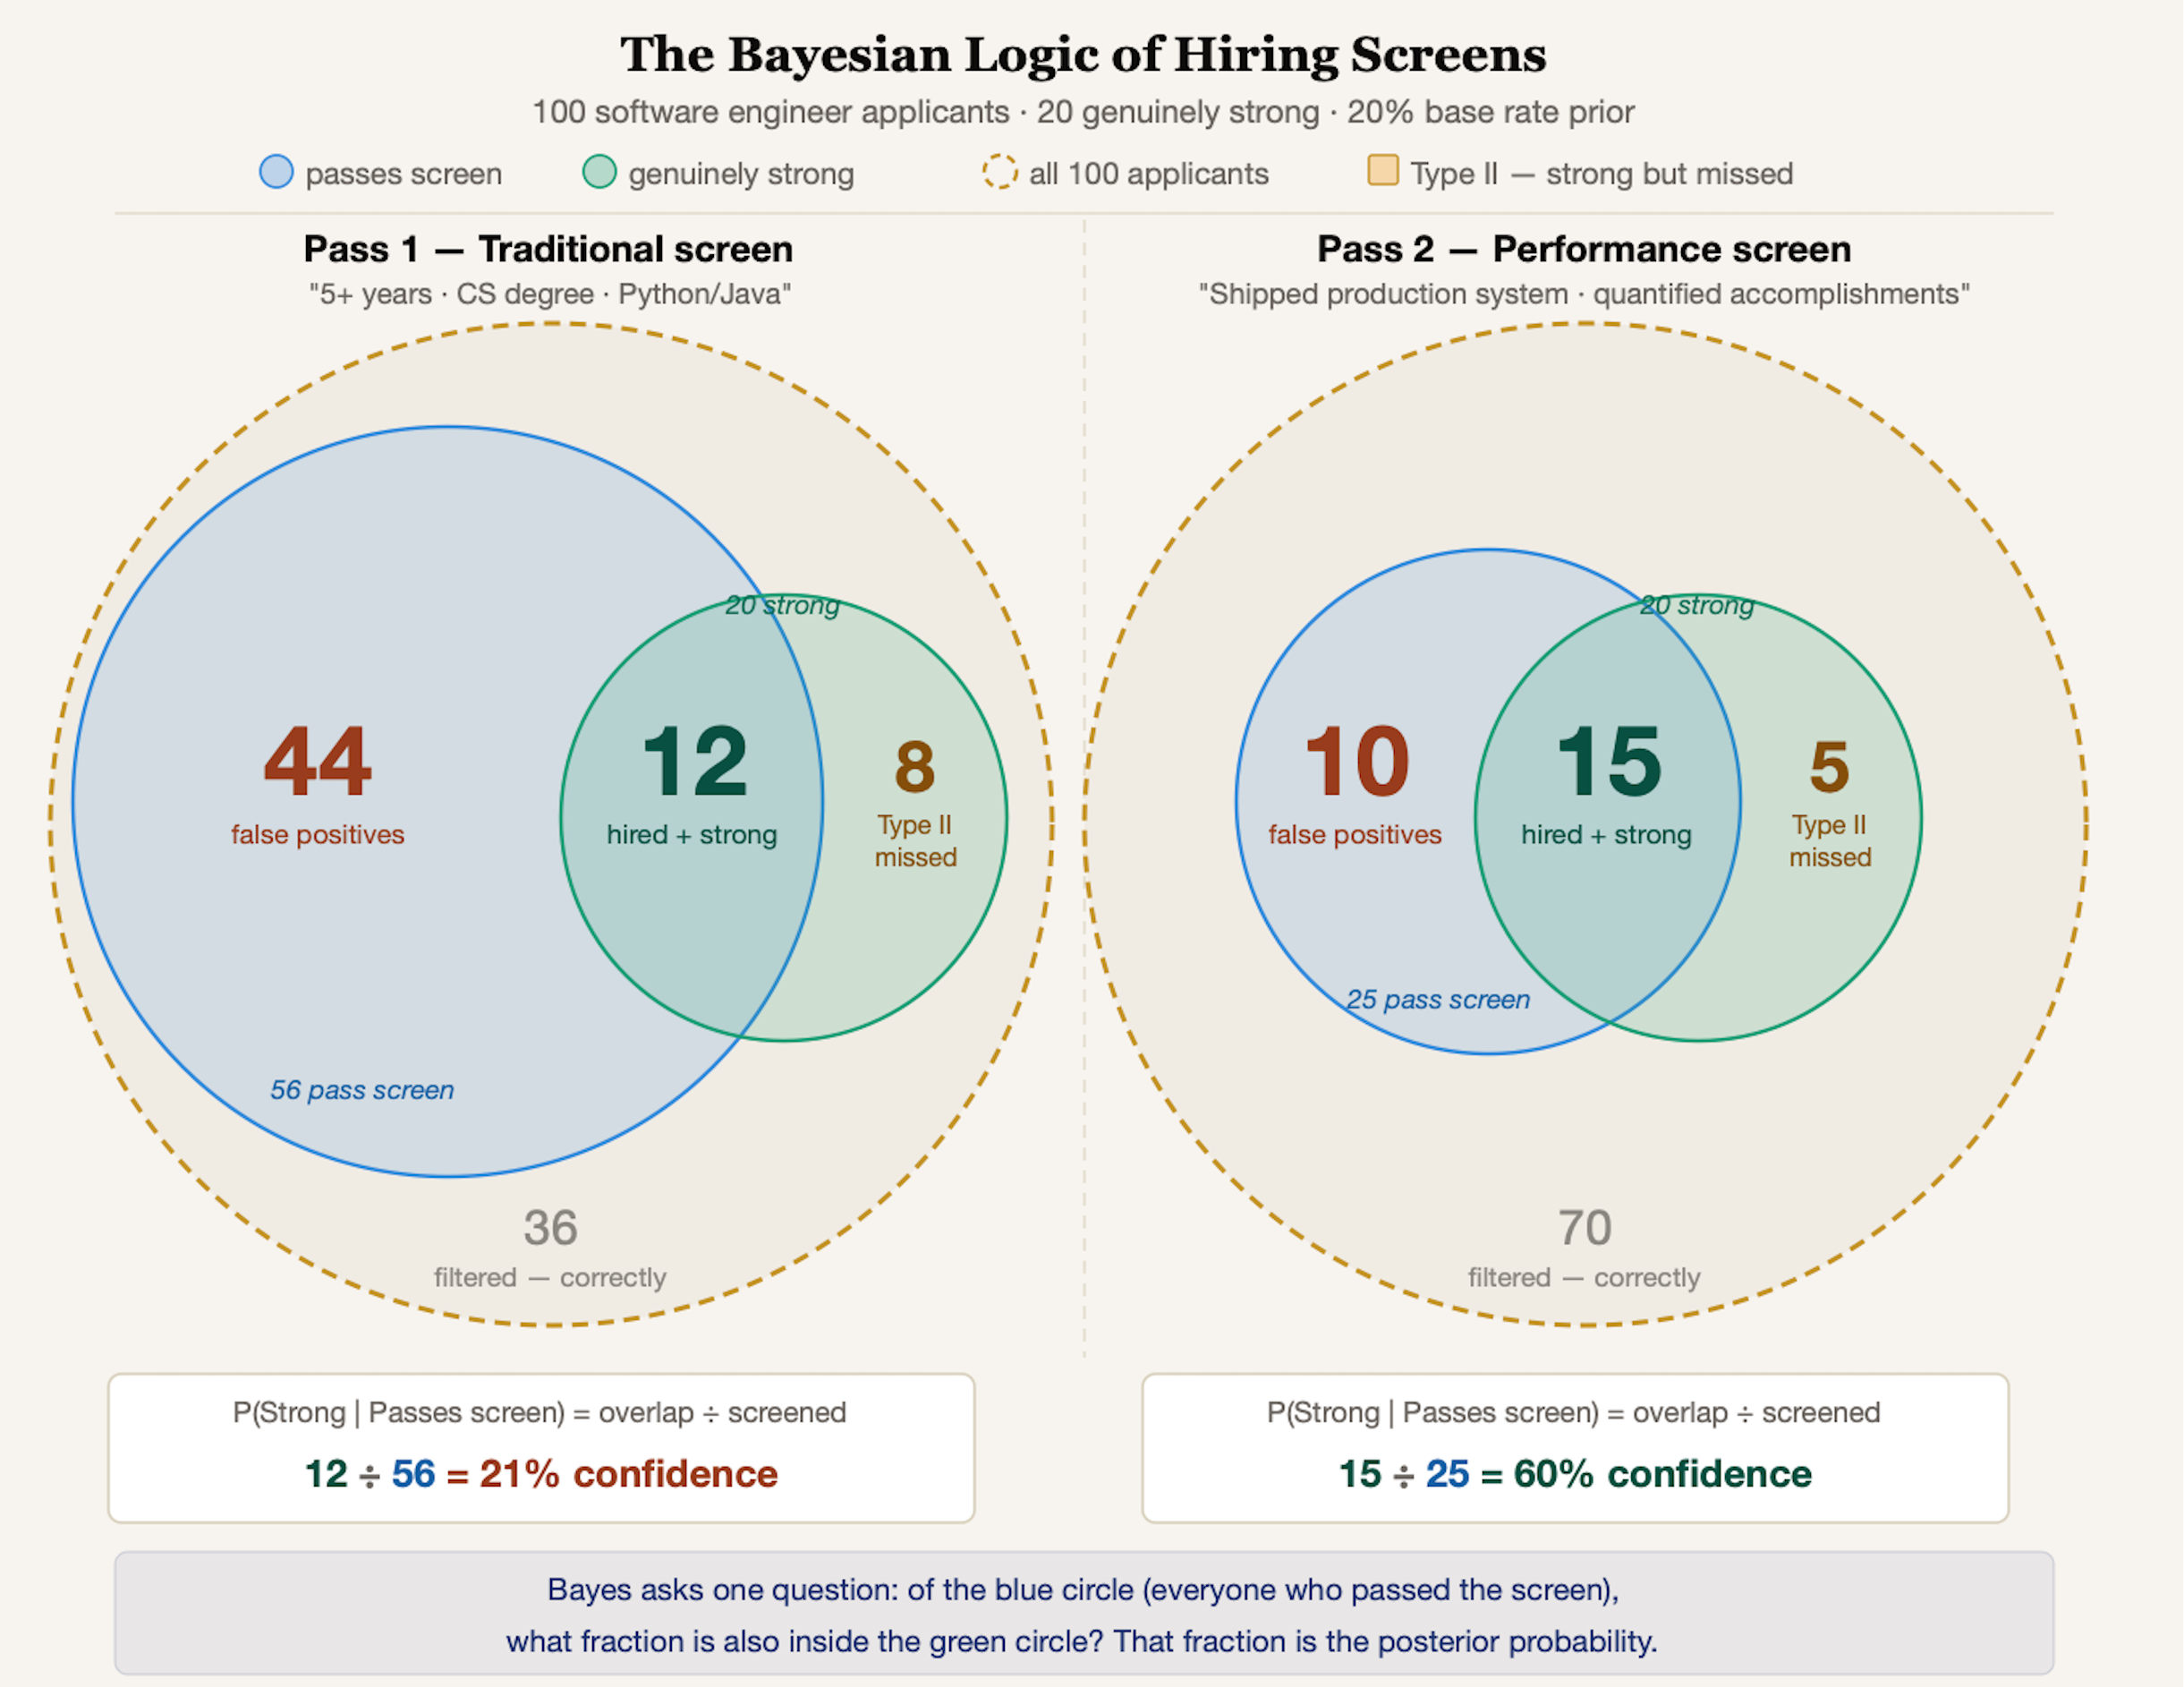
The Bayesian Logic of Hiring Screens — 100 applicants, 20 genuinely strong. The traditional screen (left) generates massive false positives and misses 8 strong candidates. The performance screen (right) produces a tighter, more accurate result.
When additional filters compound the problem
Many organizations respond to quality concerns by adding more filters. After the credential screen, they administer a GMA test and a personality assessment. Each step appears to improve the posterior. But the cumulative miss rate tells a different story.
Paul Sackett's 2022 meta-analysis — the most comprehensive review of hiring science in a generation — measured these tools as r² (the proportion of job performance variance actually explained). The findings are instructive:
| Tool | r (validity) | r² | Performance Explained |
|---|---|---|---|
| GMA / cognitive ability | 0.31 | 0.096 | 9.6% |
| Conscientiousness (best Big 5) | 0.19 | 0.036 | 3.6% |
| Structured interview | 0.42 | 0.176 | 17.6% |
r is the validity coefficient — a correlation between test scores and job performance, ranging from 0 (no relationship) to 1.0 (perfect). r² is what matters in practice: it squares r to show the actual proportion of job performance variance the tool explains. A tool with r = 0.31 sounds moderately useful; r² = 0.096 reveals it explains less than 10% of what determines whether someone succeeds. Most HR practitioners see r values from vendors — the r² number tells the real story.
Even well-researched tools like cognitive ability tests and personality assessments explain a limited portion of overall job performance variance. When used as hard elimination filters, they can increase the miss rate for capable candidates — particularly those who came through channels with a higher prior. The Bayesian consequence compounds across sequential filters:
| Stage | Pool | Strong Remaining | Cumulative Miss Rate | Posterior |
|---|---|---|---|---|
| Before any screen | 100 | 20 | 0% | 20% |
| After credential screen | 56 | 12 | 40% | 21% |
| After GMA test | ~20 | ~7 | ~65% | ~35% |
| After personality test | ~10 | ~5 | ~75% | ~50% |
The posterior improved at every stage — the process appeared to get more rigorous. Meanwhile the cumulative miss rate climbed to roughly 75%. These numbers are illustrative, not exact — but the directional finding is consistent with what the research predicts. Each low-diagnostic-ratio filter quietly reduces the pool of strong candidates alongside the weak ones.
Part Two
The Performance Filter — Taking the Lid Off Quality of Hire
The credential filter shares a fundamental design flaw with every tool layered on top of it: it screens on proxies for performance rather than evidence of performance itself. Credentials tell you what a candidate has. A performance screen tells you what a candidate has done. Only one predicts what they will do.
The bottleneck that no longer exists
There has always been a more scientifically valid screen: evaluate whether a candidate's accomplishment record maps to the Key Performance Objectives of the role. This is more predictive and more legally defensible than credential screening. The reason it hasn't replaced credentials at scale is that defining KPOs has always required a subject matter expert, a hiring manager debrief, and significant time.
That bottleneck no longer exists.
AI-powered job analysis can now generate a complete, outcome-defined performance-based job description from a single sentence in under two minutes. A prompt describing a role — with no prior domain knowledge — produces a working set of KPOs including measurable 90-day targets, process improvement objectives, and function-specific benchmarks. A recruiter who has never worked in wealth management, supply chain, or field service operations has a performance standard to screen against before the first résumé arrives.
This changes what's possible at the top of the funnel.
The two-pass filter
The solution is not to replace the traditional screen. It is to run a second, parallel screen — and let candidates clear either one to earn an interview. Think of it as a dual band-pass filter: each filter is tuned to a different signal. A strong signal in either band earns a conversation.
This matters for a reason that goes beyond the math. The performance filter finds strong candidates who do not have traditional backgrounds — people who learned faster, accomplished more with less experience, and got promoted more rapidly than their credentialed peers. These candidates are systematically eliminated by the traditional screen. They are often the highest-potential people in the pool. The performance filter is the mechanism that makes them visible.
Pass 1 — Traditional Filter. Credentials, certifications, years of experience, keyword match. The existing screen, unchanged.
Pass 2 — Performance Filter. Accomplishment record compared against the role's KPOs. Does this candidate's trajectory suggest this role is a genuine career move? Does their achiever pattern — expanding scope, increasing impact, consistent results — match what the role demands?
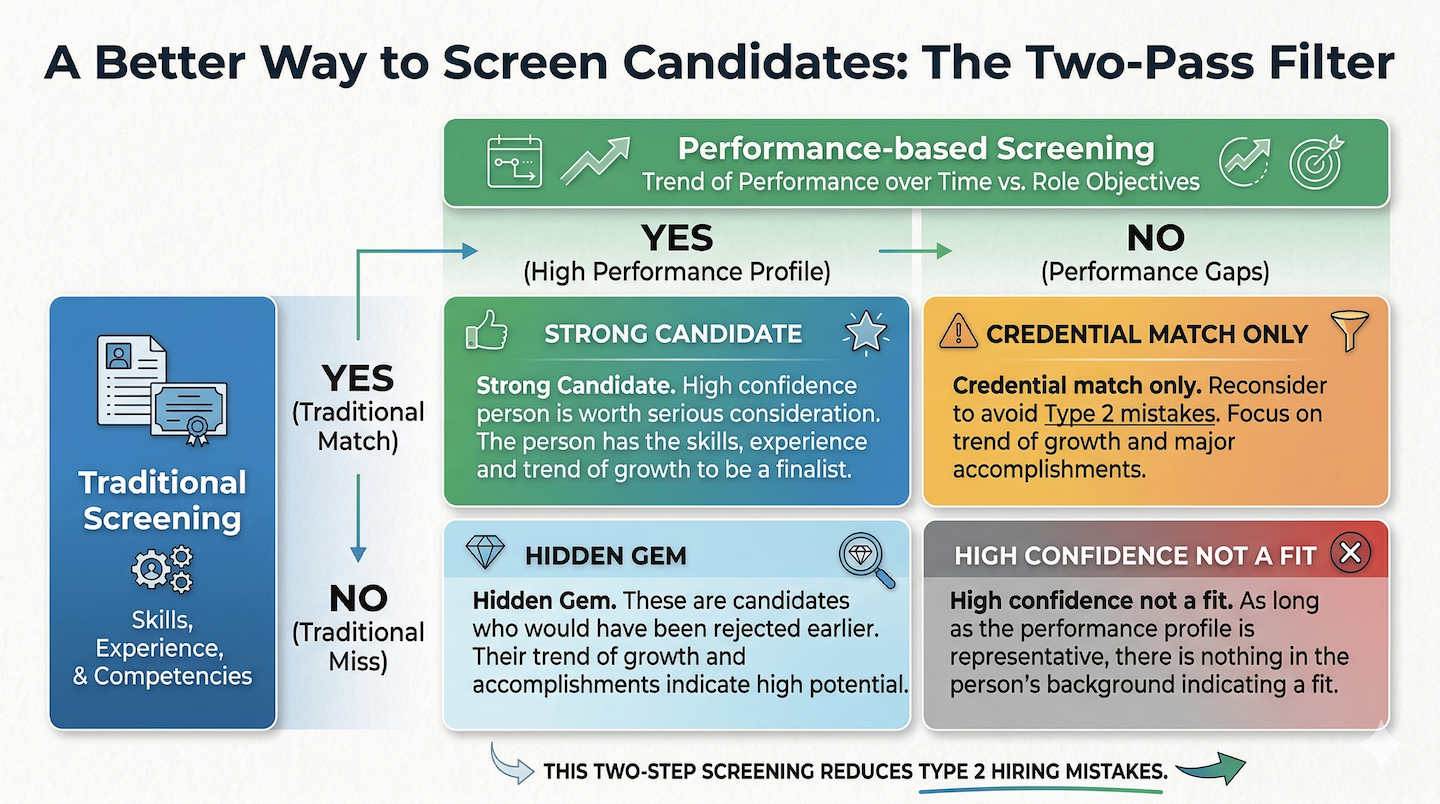
The Two-Pass Filter 2×2 matrix. The Hidden Gem cell — lower left — is where quality-of-hire improvement lives. These are candidates your competitors are not seeing.
The Bayesian calculation
| Traditional Screen | Performance Screen | |
|---|---|---|
| Candidates interviewed | 56 | 25 |
| Strong candidates found | 12 of 20 | 15 of 20 |
| Type I error (noise) | 44 of 56 = 79% | 10 of 25 = 40% |
| Type II error (missed) | 8 of 20 = 40% | 5 of 20 = 25% |
| Posterior confidence | 21% | 60% |
Every dimension improved simultaneously. Same population. Same 20 strong candidates. Same Bayes formula. A different signal — one tuned to actual performance evidence — produced a completely different result.
Part Three
Validating Sourcing Channels — Bayes as a Management Tool
There is a third application most organizations have never considered: using Bayes to systematically measure and compare the effectiveness of every sourcing channel.
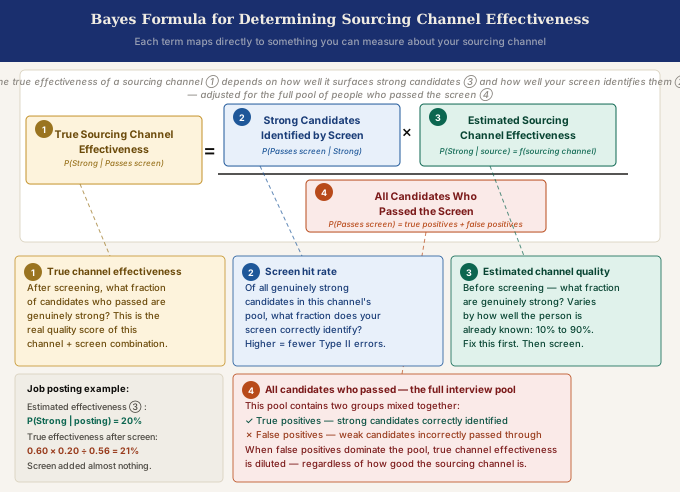
The Bayes formula restated in sourcing channel terms. Each component maps to something you can measure about any channel you're using.
The prior is not fixed — it's a strategic choice
The entire conversation about screening assumes the prior is fixed at whatever the applicant pool produces. It isn't. The prior is a direct function of where the candidates came from — and it varies enormously.
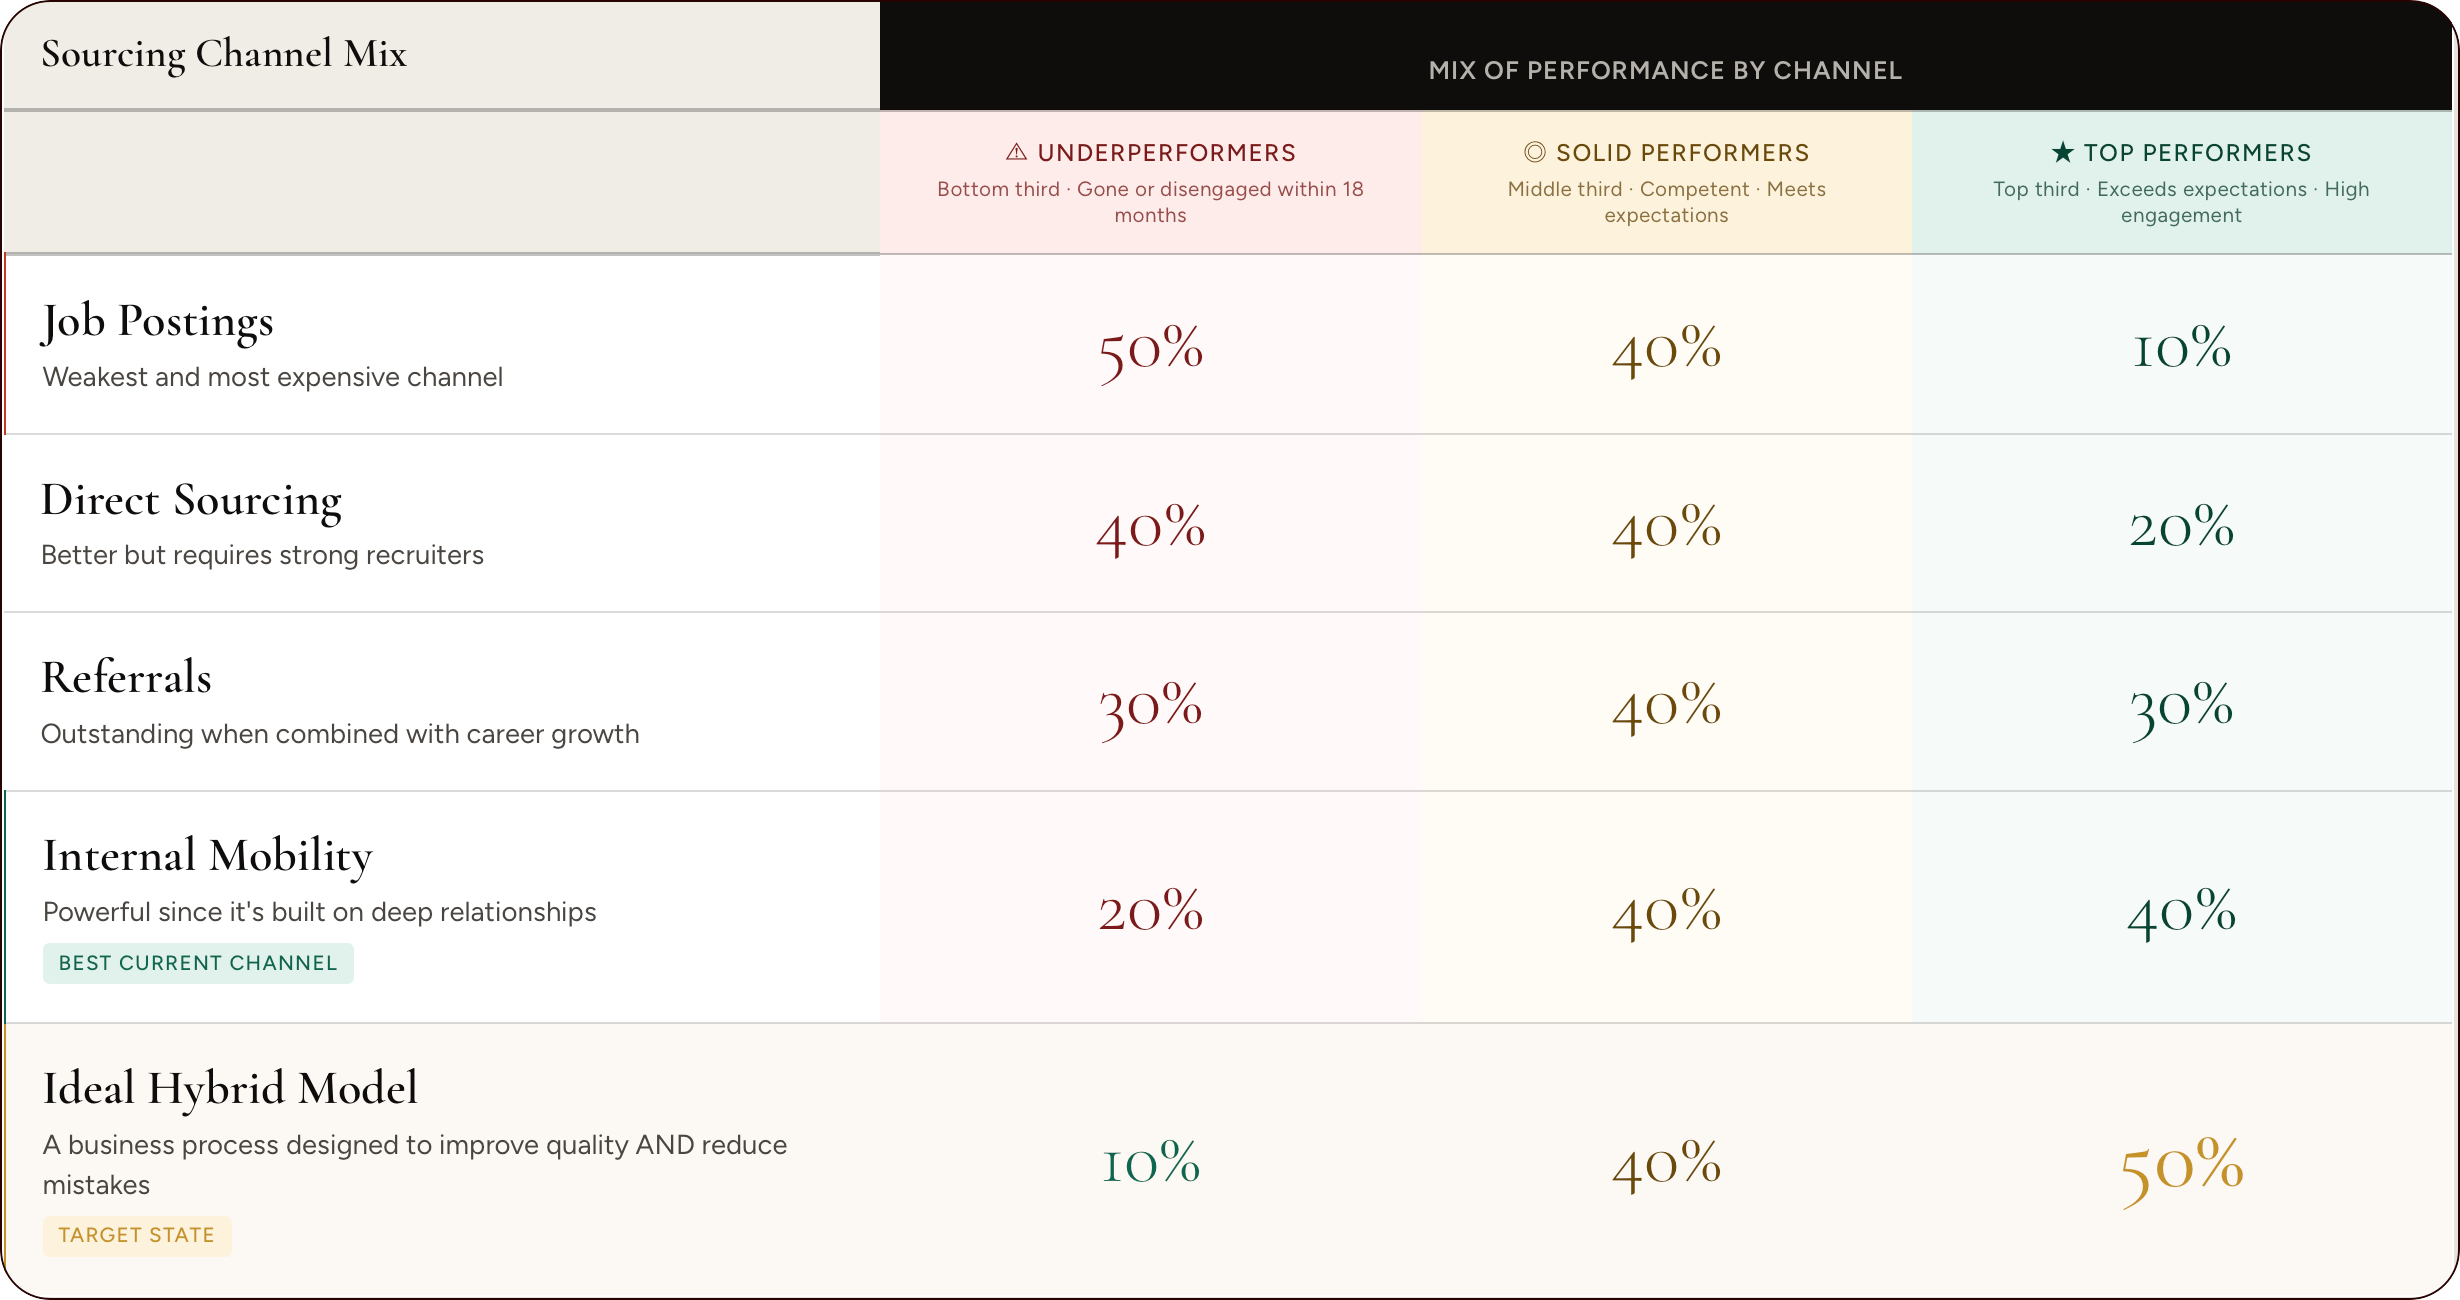
Sourcing Channel Mix: expected post-hire performance distribution by channel. Job postings produce 50% underperformers and 10% top performers. The Ideal Hybrid Model — built by applying all 12 factors — reaches 50% top performers.
The data above maps directly to the Bayesian prior for each channel. Job postings produce a 10% top performer rate — a prior of roughly 10–15% genuinely strong candidates. Internal mobility produces 40% — a prior of 40–50%. The table below is illustrative, but the directional logic is consistent with what the research predicts:
| Channel | Estimated Prior | After Traditional Screen | After Performance Screen |
|---|---|---|---|
| Job posting | 10–15% | ~13% | ~40% |
| Direct sourcing | 20–30% | ~22% | ~55% |
| Referral | 30–50% | ~33% | ~75% |
| Internal mobility | 40–60% | ~42% | ~85% |
The traditional screen adds relatively little at any prior level. The performance screen amplifies the prior more significantly — because its higher diagnostic ratio multiplies whatever signal the channel already carries.
Fix the prior first. Then screen.
The most powerful thing you can do for quality of hire is not to build a better screen. It is to raise the quality of the population the screen operates on.
Performance-based job descriptions raise the prior because they attract candidates who self-select on capability rather than credential matching. The people who read an outcome-defined job description and think "I've done this work" are a fundamentally different population from those scanning for keywords.
Proactive talent pipeline building raises the prior by cultivating relationships with candidates against performance criteria before requisitions open — rather than reacting to an opening with cold applicants.
Direct outreach built around accomplishment signals raises the prior by targeting people who have demonstrably done comparable work, not people who hold comparable credentials.
Each intervention moves the prior before the screen ever runs. A higher prior makes every screen — even an imperfect one — dramatically more effective. The formula doesn't change. The inputs do.
Bayes as a measurement system
The formula gives HR leaders something that has never existed in practice: a mathematically grounded way to compare sourcing channels on a common scale. For each channel, measure the fraction of hires who became strong performers (the prior), the screen's hit rate on those performers (the diagnostic ratio), and the overall pass rate (the denominator). Compute the true channel effectiveness score. Compare. Invest in channels with the highest priors. Cut or redesign channels whose Bayesian math says they're generating noise regardless of volume.
The Connection Back to AI
Every language model in the world is doing exactly what this article describes — just at a different scale and speed. A model trained on low-quality data has a poor prior. An attention mechanism that fails to distinguish relevant context from irrelevant noise has a diagnostic ratio near 1.0. A miscalibrated posterior produces hallucinations — the model thinks it's more certain than the evidence warrants.
These are not AI problems. They are Bayesian problems. And they are the same problems HR has been generating in its hiring processes for decades.
The prior matters. The diagnostic ratio matters. The denominator matters.
Fix all three and the framework works — whether you're predicting the next word in a sentence or the next strong hire in a role.
Sources
Sackett, P.R., Zhang, C., Berry, C.M., & Lievens, F. (2022). Revisiting meta-analytic estimates of validity in personnel selection. Journal of Applied Psychology, 107(11), 2040–2068.
Goldstein, D.J. (2013). Performance-based Hiring and Legal Compliance. White Paper, Littler Mendelson / The Adler Group.
Uniform Guidelines on Employee Selection Procedures (1978). Federal Register, 43(166), 38290–38315.
Griebe, S. et al. (2022). Meta-analysis of cognitive ability and job performance: New data. SIOP Annual Conference.